How to View Statistics & Reports
Analyse, grow and improve your business

BoothBook
Last Update 3 years ago
Use your reports dashboard to analyse, grow and improve your photo booth business.
Reports
1. Go to the Reports (gauge) icon on the left hand side
2. Click on Reports Dashboard
3. Select a date range at the top of the page and click Submit
- Reports for Financial Performance can help identify months where turnover is low
- Reports for number of Bookings can help identify trends when your customers book and could have an effect on your marketing efforts
- Reports for number of Events can help identify trends when your customers hold their events and might have an effect on when you take on extra staff
- Total Events by Staff Worked might help in sharing the event among your staff fairly
- How did you hear about us and Lead Sources will give you a good idea about which marketing efforts are more successful than others
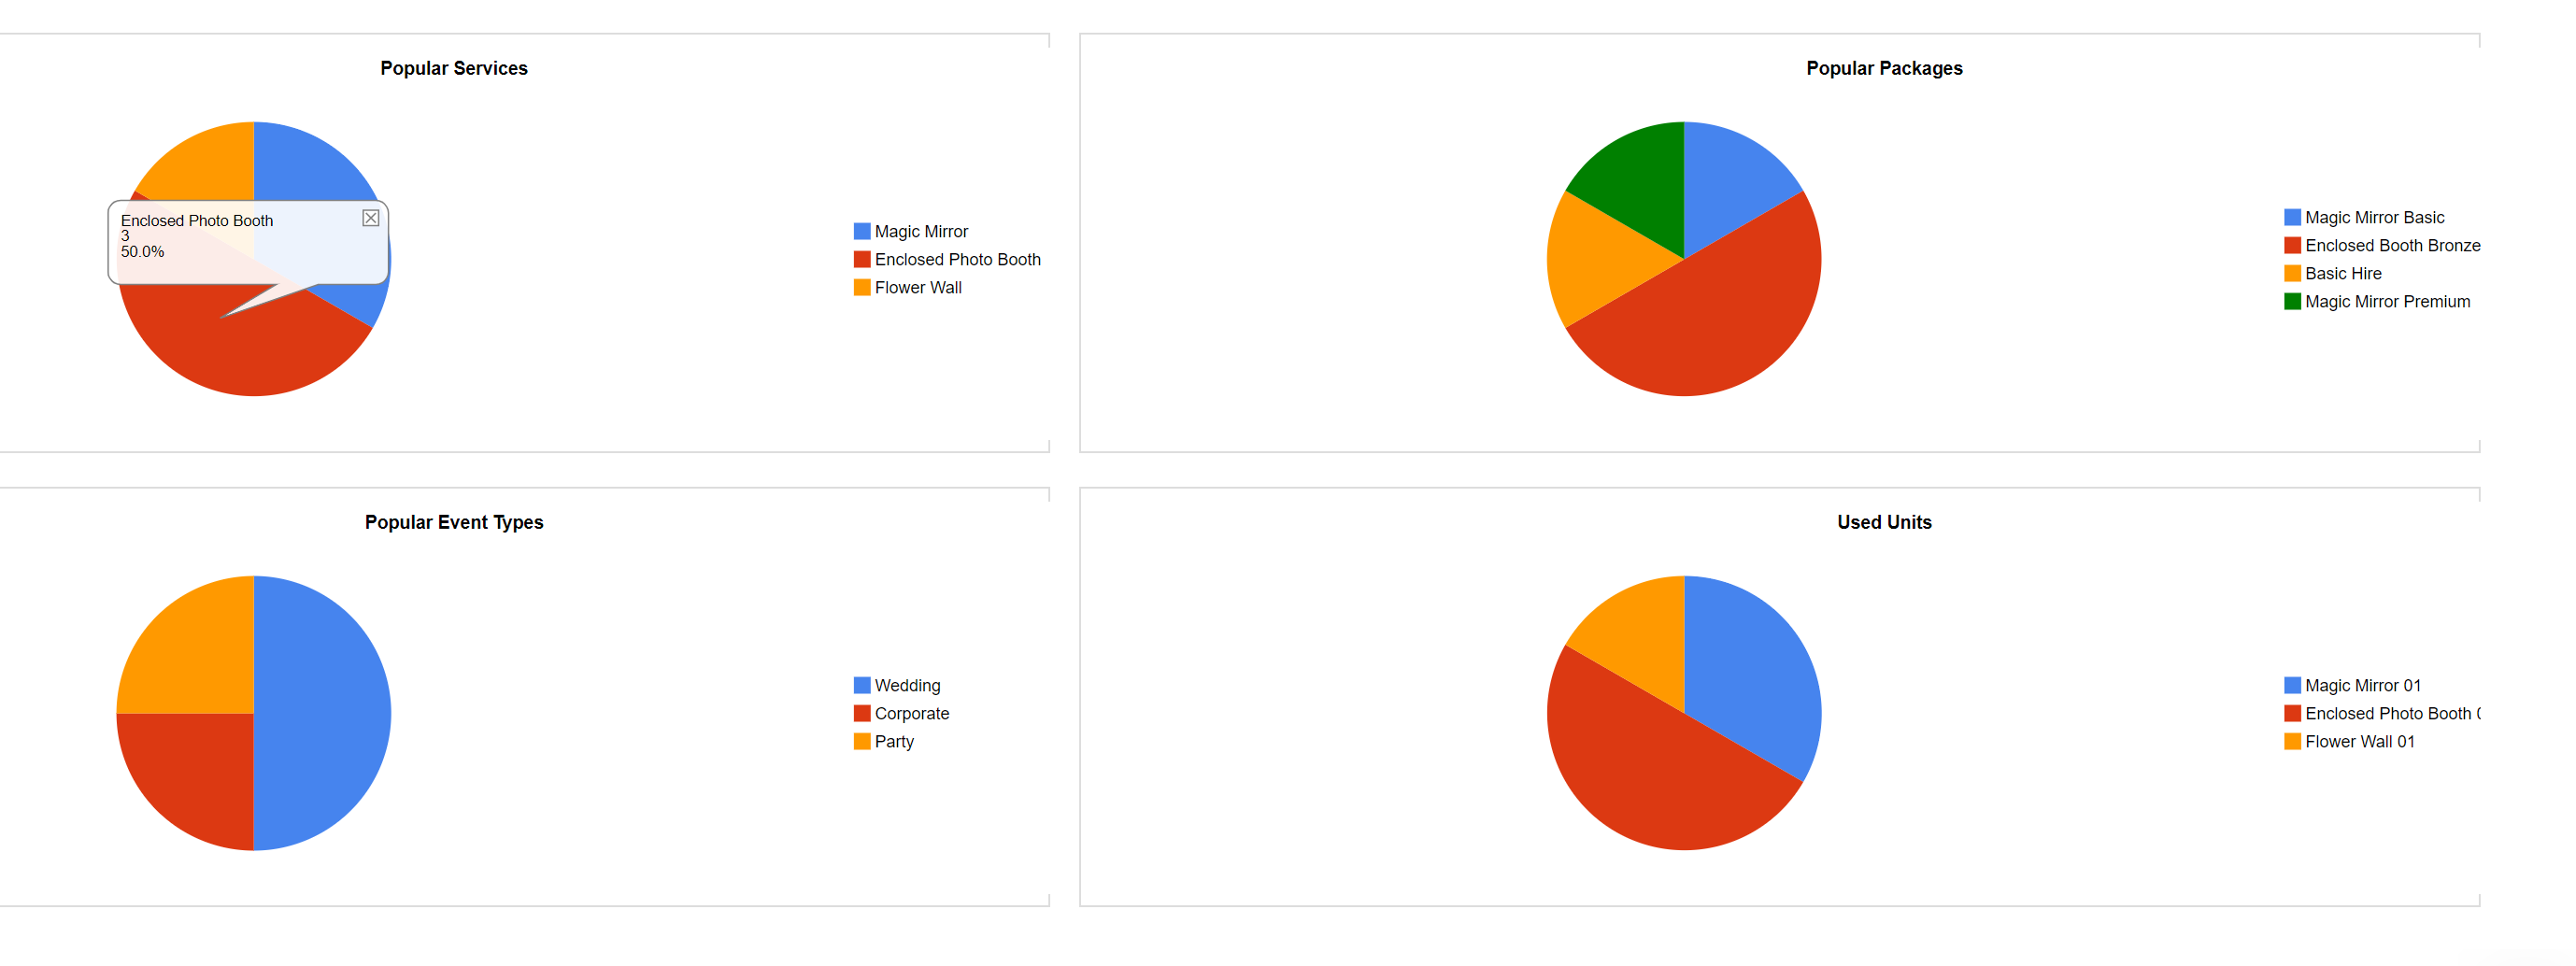
- Popular Services helps you understand which type of booth or unit is booked the most, allowing you to analyse which area you could invest more into or narrow your offering.
- Popular Packages help you identify your customer profile and which are used the most. This can help when it comes to tweaking your included Extras and package prices.
- Popular Event Types is very useful when you are trying to establish where your business is going, and where you are making the most profitable bookings.
- Used Units can be very helpful when analysing stock. If a unit has been used a lot more than others, it may be worth considering the maintenance costs for the upkeep vs. purchasing a new one.
All graph data excludes Bookings set to the Postponed or Cancelled status.
Metrics
- Go to the Reports (gauge) icon on the left hand side
- Click on Reports Dashboard
- Click on Metrics
- Select a date range at the top of the page and click Submit
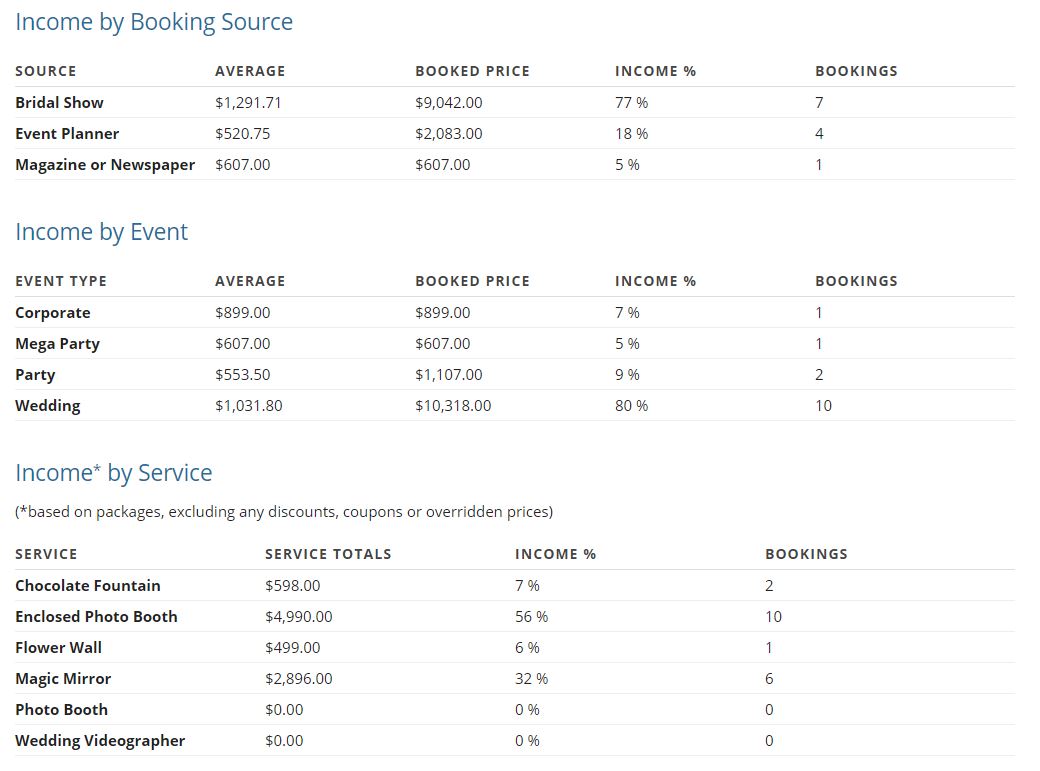
- Booking Source - view income from bookings where clients have told you on their booking form how they heard about you. Results from this could help you see where your advertising budget is better spent.
- Event Type - view income from bookings per event type. Results from this could help you better decide who you want to spend more or less time advertising to.
- Services - see an indication of income per service/ unit type based on their packages' cost (before discounts, coupons or overridden prices). Results from this indication of income can help to understand which service types have been a good investment.
- Packages - see an indication of income per package based on their base cost (before discounts, coupons or overridden prices). Results from this indication of income can help you see which packages are the most popular and improve your offering.
All data excludes Bookings set to the Postponed or Cancelled status.